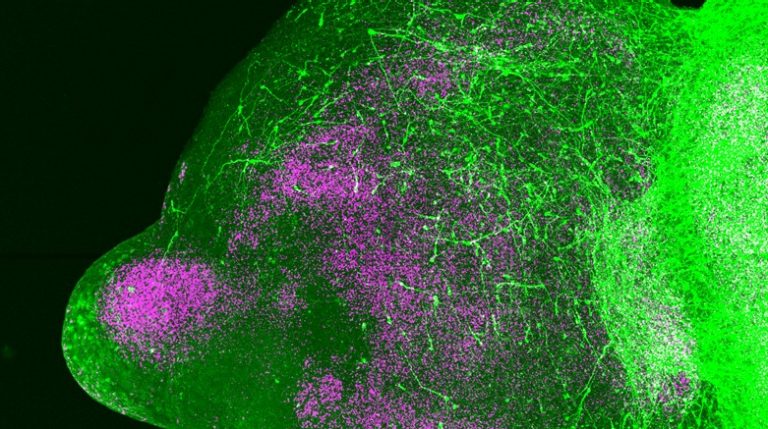
Moving RNA inside neurons
A programmable CRISPR transport system moves existing RNA inside cells, allowing researchers to test how local protein production shapes neuronal structure.
Read the article →An experimental guide to the measurement, the biological question, and the limits of interpretation.
Fluorescence microscopy uses light emitted by fluorescent labels to make selected structures visible. A label may identify a protein, a cell population or another molecular feature. Researchers choose the labeling strategy, imaging system and acquisition conditions according to the biological question. Stanford’s Cell Sciences Imaging Facility supports wide-field, confocal and other optical imaging approaches.
Images can reveal where a signal occurs, how structures are arranged and, with suitable live-cell methods, how a labeled feature changes over time. Quantitative analysis turns those images into measurements such as cell counts, distances or movement trajectories. Controls help determine whether a bright region represents the intended target and whether comparisons across samples are meaningful.
A fluorescent tag is a way to observe a chosen feature. It may mark a cell population, a protein, or a structure inside a cell. An image therefore shows a selected view of the system. Interpreting an unlabeled region as biologically empty would confuse the limits of the measurement with the absence of cells or molecules.
Exposure, illumination, labeling, and image processing affect apparent brightness. Comparisons should use acquisition and analysis rules that are appropriate to the question and applied consistently. Controls help estimate background fluorescence and unwanted signal. Live-cell imaging adds another consideration: repeated observation can change the cells through light exposure.
Measurements can include the location of a labeled structure, a cell count, or a trajectory followed over time. The analysis should state how objects were identified and how the measured images were sampled. A striking example image illustrates a result; it does not replace measurements across suitable biological replicates.
Labels and imaging conditions influence the measurement. Photobleaching, light-induced damage and limits in resolution can obscure or alter the process being observed.
A programmable CRISPR transport system moves existing RNA inside cells, allowing researchers to test how local protein production shapes neuronal structure.
Read the article →
Genetic mapping, single-cell RNA sequencing and cell experiments connect an X-linked deletion to a pigment-cell signaling switch.
Read the article →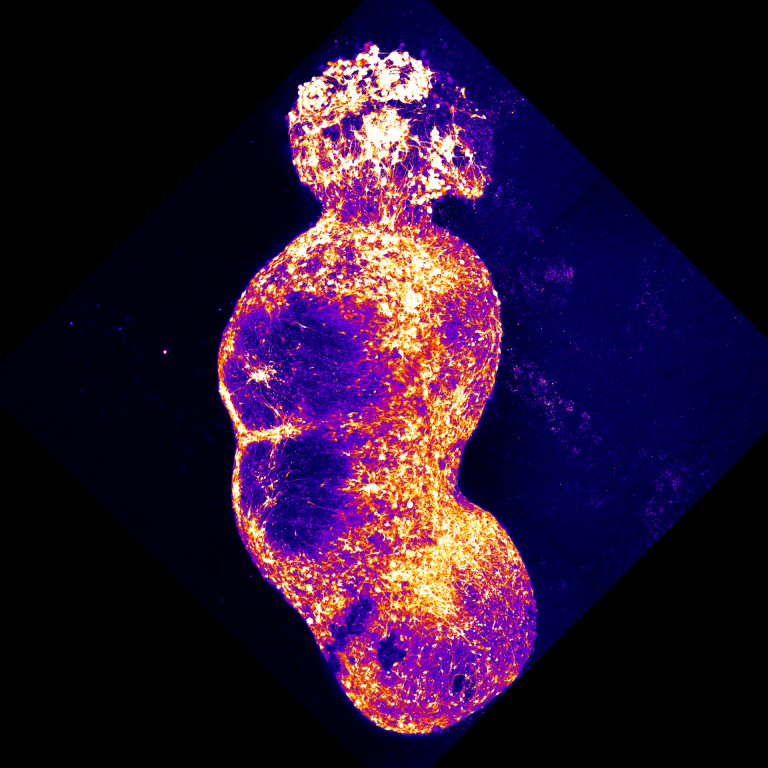
Four connected human stem-cell models let researchers watch sensory signals travel from peripheral neurons toward the cortex—and ask how pain-associated mutations change the whole circuit.
Read the article →